This website is managed by Ultima Markets’ international entities, and it’s important to emphasise that they are not subject to regulation by the FCA in the UK. Therefore, you must understand that you will not have the FCA’s protection when investing through this website – for example:
You will not be guaranteed Negative Balance Protection
You will not be protected by FCA’s leverage restrictions
You will not have the right to settle disputes via the Financial Ombudsman Service (FOS)
You will not be protected by Financial Services Compensation Scheme (FSCS)
Any monies deposited will not be afforded the protection required under the FCA Client Assets Sourcebook. The level of protection for your funds will be determined by the regulations of the relevant local regulator.
Note: UK clients are kindly invited to visit https://www.ultima-markets.co.uk/. Ultima Markets UK expects to begin onboarding UK clients in accordance with FCA regulatory requirements in 2026.
If you would like to proceed and visit this website, you acknowledge and confirm the following:
1.The website is owned by Ultima Markets’ international entities and not by Ultima Markets UK Ltd, which is regulated by the FCA.
2.Ultima Markets Limited, or any of the Ultima Markets international entities, are neither based in the UK nor licensed by the FCA.
3.You are accessing the website at your own initiative and have not been solicited by Ultima Markets Limited in any way.
4.Investing through this website does not grant you the protections provided by the FCA.
5.Should you choose to invest through this website or with any of the international Ultima Markets entities, you will be subject to the rules and regulations of the relevant international regulatory authorities, not the FCA.
Ultima Markets wants to make it clear that we are duly licensed and authorised to offer the services and financial derivative products listed on our website. Individuals accessing this website and registering a trading account do so entirely of their own volition and without prior solicitation.
By confirming your decision to proceed with entering the website, you hereby affirm that this decision was solely initiated by you, and no solicitation has been made by any Ultima Markets entity.
Ultima Markets does not have an establishment in Singapore and does not operate from Singapore.
Ultima Markets does not provide products or services to citizens or residents of Singapore, and account applications from Singapore citizens or residents will not be accepted.
If you are a citizen or resident of Singapore, please do not open an account or use Ultima Markets’ products or services.
By selecting “Acknowledge and Continue Browsing”, you confirm that you are accessing this website on your own initiative and that your access is not the result of any direct marketing, targeted advertising, solicitation, or promotional activity by Ultima Markets.
Nothing on this website constitutes an offer, solicitation, or promotion of products or services in any jurisdiction where such activity is prohibited. You are responsible for ensuring that your access to and use of this website complies with applicable local laws and regulations.
Learn what hollow candles mean, how to read green, red, filled and hollow candlesticks, and how traders use them to understand price action and momentum.
If you are familiar with traditional red and green candlestick charts, hollow candles may look slightly confusing at first. Some candles are empty, others are filled, and you may even see a red candle that rises from its opening price or a green candle that falls.
This happens because hollow candlestick charts can display two price relationships at the same time. The fill of the candle shows how the closing price compares with its opening price, while the colour can show how the latest close compares with the previous candle’s close. This gives traders another way to study price action without changing the underlying open, high, low and close data.
What Are Hollow Candles?
Hollow candles are a variation of Japanese candlesticks that use both colour and body fill to represent price movement.
Like regular candlesticks, each candle contains four main prices:
Open: Price at the beginning of the period
High: Highest price reached
Low: Lowest price reached
Close: Price at the end of the period
The body represents the distance between the opening and closing prices, while the upper and lower wicks show the highest and lowest prices reached during that period.
What makes hollow candlesticks different is how this information is displayed.
Under the commonly used TradingView convention:
Hollow or filled tells you about the current open and close.
Green or red tells you about the current close and previous close.
It is important to check your chart settings because colours can be customised and conventions may vary between platforms.
How to Read Hollow Candles
The easiest way to read hollow candles is to look at the body first.
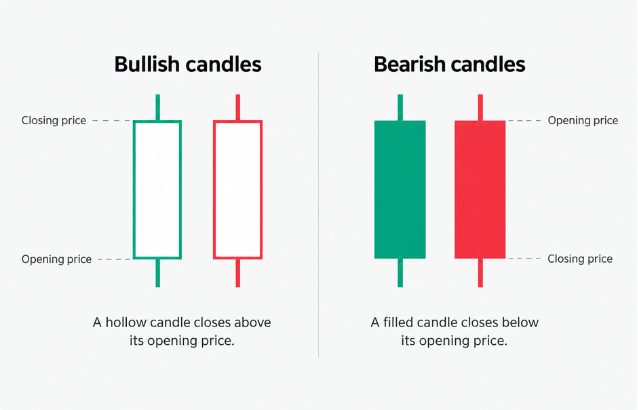
A hollow body means the closing price is higher than the opening price.
A filled body means the closing price is lower than the opening price.
Then look at the colour. On TradingView’s Hollow Candles chart:
Green means the current close is above the previous close.
Red means the current close is below the previous close.
Combining these two rules creates four possible types of hollow candlesticks.
Candle type
Current close vs open
Current close vs previous close
Green hollow
Higher
Higher
Green filled
Lower
Higher
Red hollow
Higher
Lower
Red filled
Lower
Lower
Green Hollow Candle
A green hollow candle means the price closed above both its current opening price and the previous candle’s close.
For example:
Previous close: $100 Current open: $101 Current close: $105
The price rose during the current period and also finished above the previous closing level.
Green Filled Candle
A green filled candle can initially look contradictory.
Imagine:
Previous close: $100 Current open: $105 Current close: $102
The price fell from $105 to $102 during the current period, so the body is filled. However, it still finished above the previous $100 close, so the candle is green.
This shows why looking only at candle colour can miss part of the story.
Red Hollow Candle
A red hollow candle is another combination that often confuses beginners.
For example:
Previous close: $100 Current open: $95 Current close: $98
The price increased from $95 to $98 during the current period, making the body hollow. However, it remained below the previous $100 close, so the candle appears red.
This shows intraperiod buying strength, but the market has not yet recovered above its previous closing level.
Red Filled Candle
A red filled candle occurs when the current close is below both the open and the previous close.
For example:
Previous close: $100 Current open: $99 Current close: $95
Selling pressure dominated the period and the market finished below its previous closing level.
Hollow Candles vs Regular Candlesticks
Both chart types use the same basic OHLC data, but they present it differently.
Regular candlesticks usually focus primarily on the relationship between the current open and close. A green candle commonly means the price closed above its opening level, while red means it closed below.
Hollow candles add another visual comparison by showing the current close relative to the previous close.
This does not mean they contain additional market data. Rather, the same price information is encoded differently, which can make changes between consecutive periods easier to identify.
Regular candlesticks may therefore feel simpler, while hollow candlesticks can provide additional visual context for traders who closely follow closing-price behaviour.
What Can Hollow Candles Tell Traders?
One individual candle should not automatically be treated as a buy or sell signal. The surrounding candles often provide more useful information.
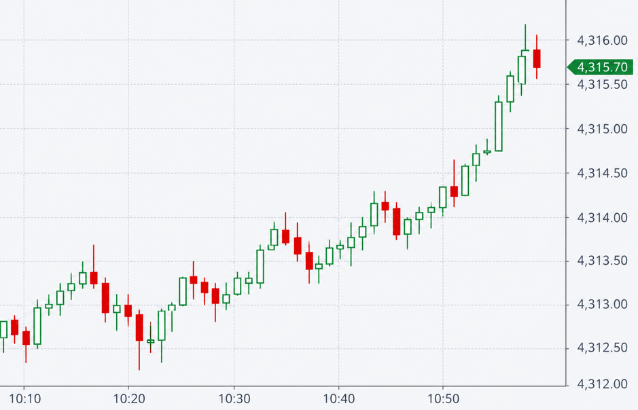
For example, a sequence of green hollow candles may occur as buying pressure continues through an upward move. If those candles begin changing into filled bodies, it can indicate that price behaviour within each period is changing.
Body size also matters. A large candle shows a wider difference between the open and close, while a small body indicates that the two prices finished relatively close together.
Wicks add another layer of context. A long upper wick can show that prices traded significantly higher before retreating, while a long lower wick shows that prices fell before recovering.
As with other candlestick techniques, these features are generally more useful when interpreted alongside the wider market structure rather than in isolation.
Hollow Candles vs Heikin Ashi
Hollow candlesticks should not be confused with Heikin Ashi candles.
The key difference is how their prices are calculated.
Hollow Candles
Heikin Ashi
Display conventional OHLC data
Use calculated average values
Focus on price relationships
Focus on smoothing price movement
Show actual period prices
May differ from actual market prices
Useful for studying price action
Often used to visualise trends
TradingView explains that Heikin Ashi uses average prices calculated partly from previous candle values. This produces a smoother chart but means the displayed candle prices are not the same as standard market OHLC values.
Hollow candles, by contrast, keep conventional candlestick price data and change how those relationships are visually presented.
How to Use Hollow Candles in Trading
Rather than using a single candle as a trading signal, traders can combine hollow candles with other forms of technical analysis.
Trend analysis: Look at sequences of candles rather than one candle alone. Changes between hollow and filled bodies may help highlight shifts in short-term behaviour.
Support and resistance: Watch how candles behave when price reaches an established technical level. Long wicks, changing body types or repeated failed moves can provide additional context.
Volume: Volume can help assess how much market participation accompanies a price movement.
Technical indicators: Moving averages, RSI or ATR can be used alongside candlestick analysis to provide trend, momentum or volatility context.
The aim is not to find one candle that predicts the next move. Instead, the candles can form part of a wider analysis of market conditions.
Limitations of Hollow Candles
Although hollow candlesticks can make certain price relationships easier to recognise, they have limitations.
They do not show exactly how every price movement occurred within a candle. One candle simply summarises the open, high, low and close for its selected period.
They also do not automatically show trading volume or explain why a market moved.
Most importantly, the appearance of one candle does not confirm what will happen next. TradingView similarly recommends considering broader context rather than relying solely on candlestick or automated pattern signals.
For these reasons, hollow candles are best viewed as a way of presenting price data, rather than a standalone trading strategy.
Understanding Hollow Candles at a Glance
The simplest way to remember hollow candles is:
Hollow or filled = current close compared with current open.
Green or red = current close compared with the previous close, depending on your platform settings.
Once you understand these two relationships, unusual combinations such as red hollow or green filled candles become much easier to interpret.
Hollow candlesticks can help traders see how price behaves both within the current period and relative to the previous close. Combined with trend analysis, support and resistance, volume and other technical tools, they can provide another useful perspective on market price action.
FAQ
What does a hollow candle mean?
A hollow candle means the closing price finished above the opening price for that period.
Is a hollow candle bullish?
It shows that price rose from its open, but the broader meaning depends on its colour, previous close and market context.
What does a red hollow candle mean?
It means price closed above its current open but below the previous candle’s close.
What does a green filled candle mean?
It means price closed below its current open but remained above the previous candle’s closing price.
Share Now
Disclaimer:This content is provided for informational purposes only and does not constitute, and should not be construed as, financial, investment, or other professional advice. No statement or opinion contained herein should be considered a recommendation by Ultima Markets or the author regarding any specific investment product, strategy, or transaction. Readers are advised not to rely solely on this material when making investment decisions and should seek independent advice where appropriate.
Thank you for visiting the Ultima Markets website. Please note that this website is intended for individuals residing in jurisdictions where access is permitted by law. Ultima and its affiliated entities do not operate in your home jurisdiction.
By clicking ‘Acknowledge’, you confirm that you are entering this website solely on your own initiative and not as a result of any specific marketing outreach. You wish to obtain information from this website based on reverse solicitation principles, in accordance with the applicable laws of your home jurisdiction.